
A huge number of academic papers, particularly in the fields of computer systems/architecture, use some sort of block diagram to give readers an overview of the solution being presented. For instance, about two thirds of the papers presented this year at ASPLOS contained at least one of these diagrams, usually towards the start of the paper. Some of these are shown below:


These block diagrams typically consist of blocks that represent actions and arrows that are labelled with the inputs and outputs that are passed around between those actions. They can be quite eye-catching, and often appear to be rather easy to understand, which explains why they are used so widely.
In this blog post, I will explore some guidelines for drawing these diagrams so that they really are easy to understand.
First, it is worth noting that a block diagram is a form of (directed) bipartite graph. That is, it can be seen as a graph with two types of vertices: action vertices and data vertices. Each edge in the graph connects an action vertex to a data vertex (or vice versa); there are no edges from actions to actions or from data to data.
This leads us to the first way to draw a block diagram: explicitly as a bipartite graph, as in the following diagram for a very simple compiler.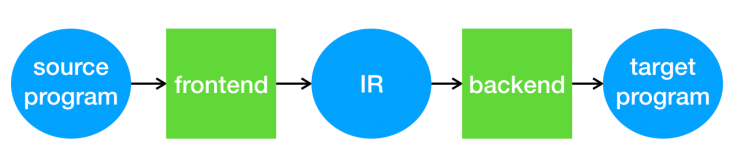
Note the importance of clearly distinguishing the two different types of vertex. Some of the ASPLOS diagrams above did not do this, which makes them unnecessarily hard to understand.
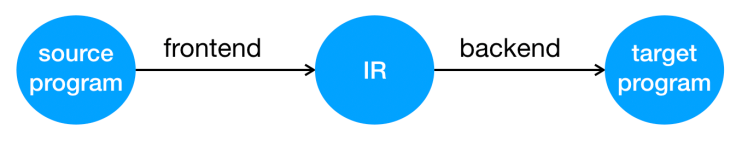
The second way is to remove the action vertices, and instead to have the actions appear as labels on arrows between data vertices, as shown below. The advantage of this representation is that we no longer need two different styles of vertex.
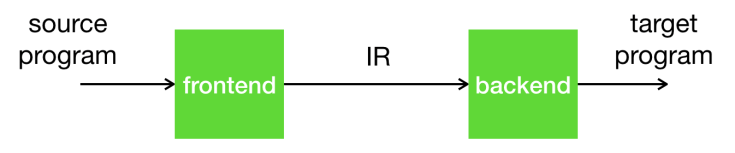
The third way is to remove the data vertices, and instead to have the data appear as labels on arrows between action vertices, as shown below. This style also avoids the need for two different styles of vertex, though it has the slight disadvantage that one is never quite sure whether the first and last labels should be drawn above the arrows (as I have done here) or just beyond their tips. Which style of diagram is chosen may depend on whether one wishes to emphasise the sequence of actions that a system takes, or the data that it operates on.
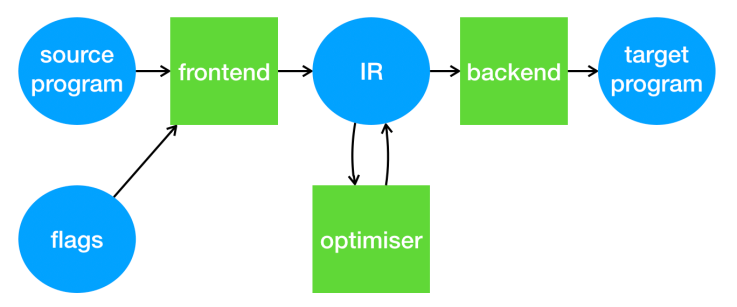
The problem with these latter two representations is that they don’t scale very well to more complicated designs. For instance, suppose we start with the following diagram of a more complicated compiler.
If we try to draw this diagram in the “data-oriented” style, it becomes tricky to place the labels of actions that consume multiple pieces of data. See, for instance, the awkward “frontend” label in the picture below.
 On the other hand, if we try to draw this diagram in the “action-oriented” style, it becomes tricky to deal with pieces of data that are consumed or produced by multiple actions, such as the “IR” data in the picture below.
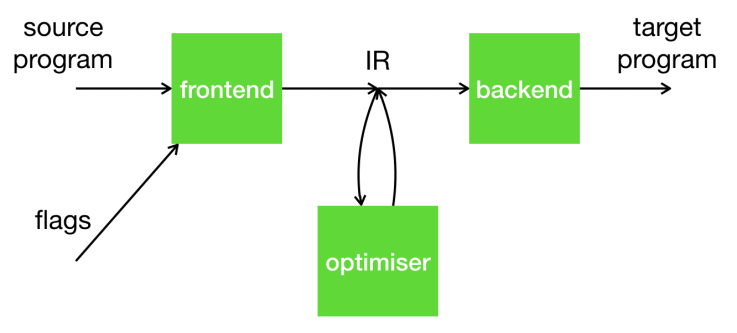
To conclude: action-oriented and data-oriented block diagrams are fine in simple cases, and can lead to simpler diagrams than those that make the bipartite structure explicit. But when there are bifurcations in the control flow or data flow of a system, it may be better to resort to the explicit bipartite representation.
